ABOUT THE MAP
|
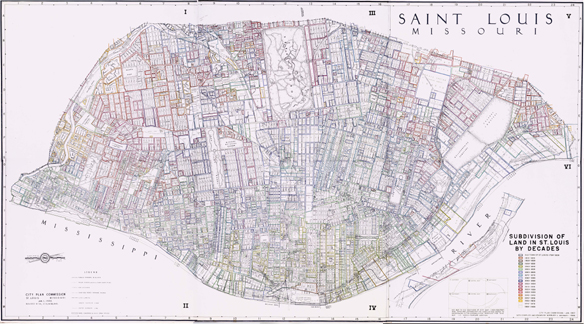
About the Wayman Subdivision Map of St. Louis Norbury Wayman developed this map in 1967 from his extensive research into St. Louis public records. It has been reproduced in digital form by Washington University, from an original copy held in the collections of the Missouri Historical Society. Wayman, who worked for the city's planning agency for a number of years, developed an interest in the history of St. Louis neighborhoods and authored a number of pamphlets that remain valuable to students of St. Louis neighborhood history. This map documents each subdivision, addition, and re-subdivision of property made in the city of St. Louis, from 1816 (when Auguste Chouteau and J.B.C. Lucas effectively expanded the city's original colonial boundaries west to the site of the Old Cathedral) to the time of the map's creation. What is a Subdivision? Subdivisions and additions provide the legal means by which property owners may begin to develop their land for urban uses. As such, a subdivision deed is accompanied by a survey showing the dimensions of the blocks and lots that will be offered for sale, as well as the locations of the projected streets that will run between them. In addition (with the notable exception of St. Louis's private places), the subdivider deeds to the city the right to own and improve as a public right-of-way the land reserved for streets. Finally, the owner uses the opportunity to impose any restrictions he wishes (within the limits of the law) on the future development of the land within his properties. This final function was an important aspect of urban development in the days before municipally imposed zoning codes. How Can I Use this Map? What this map shows is not the actual subdivision surveys or accompanying terms (all of which are available through the Recorder of Deeds' office), but simply the location, year, and name of each. With this information, a researcher can nevertheless learn a great deal. In fact, a knowledge of the origins of this most basic unit of urban growth is vital to any attempt to understand the historical, architectural, geographical, social, or economic aspects of growth in a city as complex as St. Louis. Captured here in digital form, Wayman's labor will hopefully live on indefinitely as a resource for all those residents or scholars who seek to learn more about the city of St. Louis. One caveat for the researcher: the names of each subdivision are not necessarily identical to the names of the individuals who dedicated them. For example, "John Smith's Second Subdivision" may in fact be a subdivision of land once owned by the late John Smith but now owned by a number of his heirs. The "Vine Grove Subdivision" and others with similar names likewise have been developed by one or more individuals; the names of those individuals are likewise missing from Wayman's list. For full information on such issues, a researcher needs to turn, once again, to the actual subdivision books. |
Composite Map

History of the Composite Map
The Composite Wayman map was created during the spring season of 2001. It was the joint effort of Prof. Jacqueline Tatom and Joseph Sheehan, who worked carefully with the details of each of the 6 Wayman Maps to create a composite map. This composite map features all 6 Wayman maps in a format that allows researchers to look and study the entire city of St Louis without the need for multiple maps, detailed bookkeepping, etc. PLEASE NOTE: This map is an original work and is not part of the original Wayman Collection.
Creation of the Composite Map
The Composite Wayman map was created with Adobe Photoshop 5.5. Using the original images at their original size and resolution, each map's border was erased and edited such that marker lines and other stray lines and dots were removed. Each map was paired with the map directly above or below it (i.e. Map 1 was paired with Map 2, etc) and those two maps were carefully joined so that as many common elements to the maps overlayed each other and the "new map" appeared to look just like one unaltered map. Then, each of the pairs of maps, three in all, were added to a new image, one by one, and carefully joined so that the map appeared to be a unique work and not the product of seperate maps.
Unfortunately, all elements in all of the maps did not line up perfectly, so some sacrifices in terms of accuracy had to be made. However, we feel that the final product is the best possible alignment of all 6 maps.